Indicators Matrix
Analyze your indicators and scenarios.
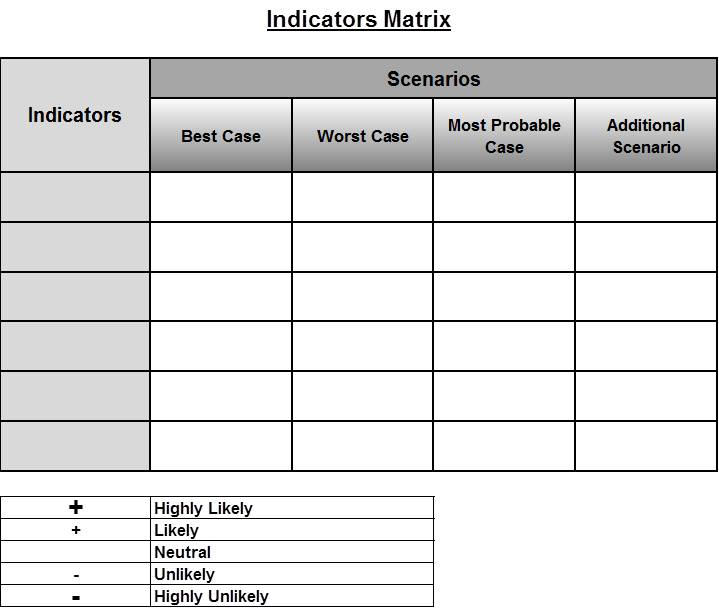
Indicators Matrix tool was designed to examine the diagnostic power of your indicators. It’s a simple matrix with indicators listed down the left-hand column and different scenarios going across the top.
To create a Indicators Matrix:
Step 1: List all your indicators down the left-hand column (see diagram below).
Step 2: The columns of the matrix are used to list your scenarios. Across the top of the matrix write your: 'best case' scenario, 'worst case', 'most probable case', and then any additional possible scenarios. Also add a brief description to each of your column headings.
Step 3: Assign a likelihood to each indicator/scenario pairing. You can use a simple plus/minus system: use a bold plus (+) for a 'highly likely' to appear, plus (+) for 'likely', blank for 'neutral', minus (-) for 'unlikely', and bold minus (-) for 'highly unlikely'.
Analysis of your Indicators Matrix:
- Pay close attention to indicators that are 'highly likely' for one scenario and 'highly unlikely' for all the others.
- Also pay close attention to indicators that are 'highly unlikely' for one scenario and 'highly likely' for all the others.
- Rank your indicators by how well they diagnose scenarios.
- Frequently check your indicators that rank high in diagnostic power.
The best indicators have diagnosticity. In other words, these indicators show that one scenario is more (or less) likely to occur than all of the others. Conversely, if indicators are common to many scenarios then they have less diagnostic power.
Diagram of our Indicators Matrix:

Word version of Indicators Matrix.docx (Click link to download Word version).
Excel version of Indicators Matrix.xlsx (Click link to download Excel version).
PDF version of Indicators Matrix.pdf (Click link to download PDF version).

Sources:
Handbook of Analytic Tools and Techniques, Randolph H. Pherson, Reston, VA: Pherson Associates, 2008.
Structured Analytic Techniques for Intelligence Analysis, Richards Heuer, Jr. and Randolph H. Pherson, Washington DC: CQ Press, 2011.
